FactoryVue crest with Monitor, Predict, Plan and Maintain pillars

Industrial visibility, built for real plant

Monitor. Understand. Maintain.

FactoryVue brings production, energy, machine condition, levels and maintenance activity into one clear view—without forcing you to replace the equipment that already works.

  • Live and historical data
  • Alerts that reach the right people
  • Cloud, on-premise or hybrid
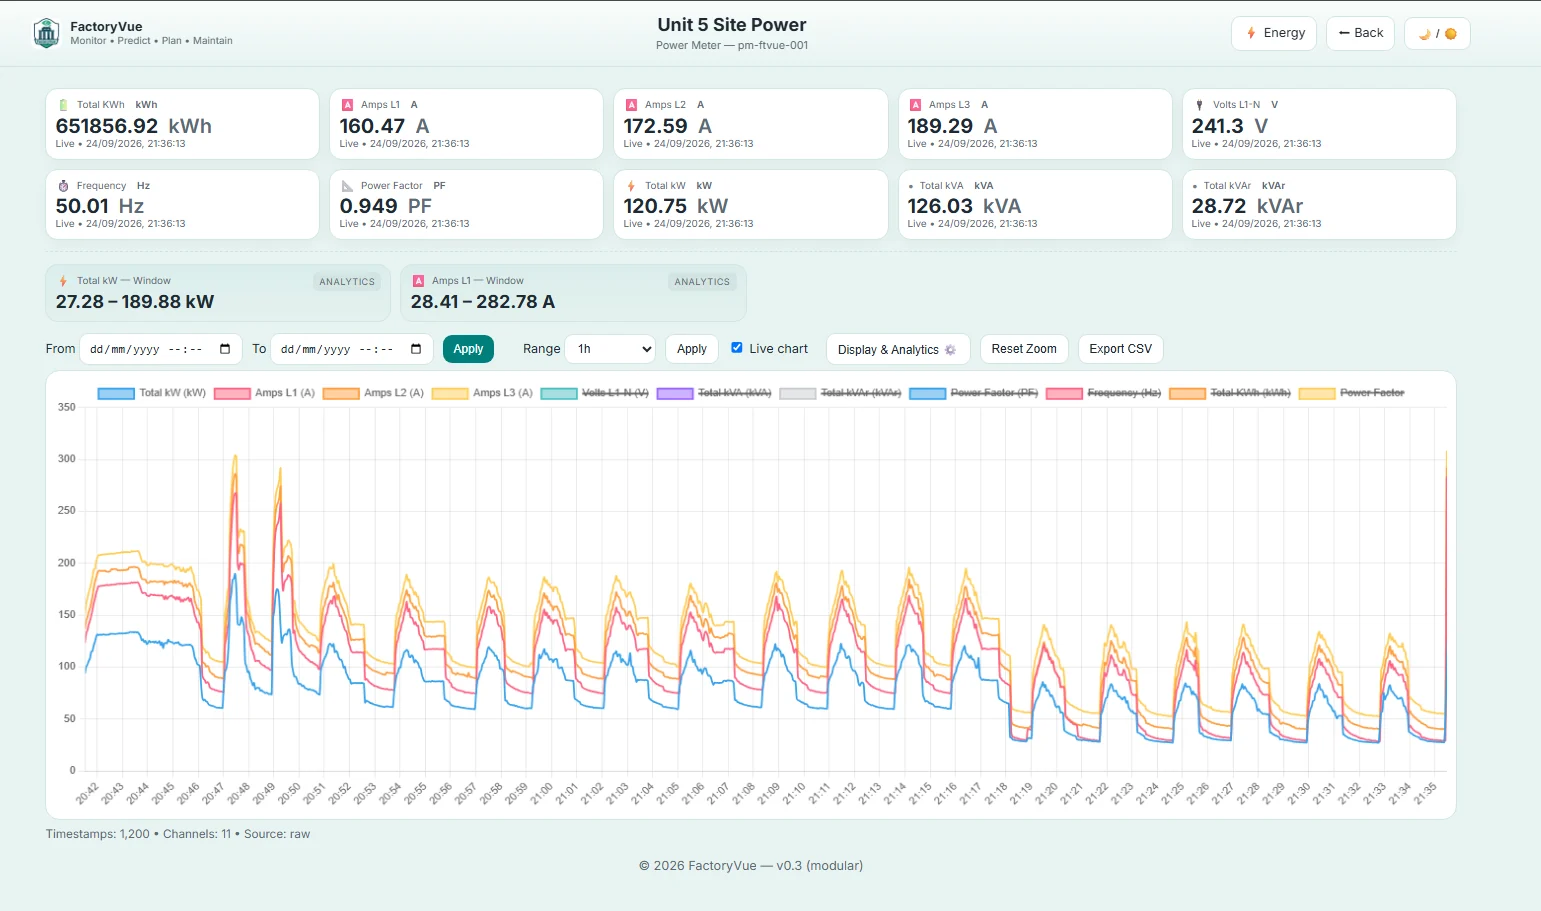
FactoryVue site power dashboard showing live electrical values and a multi-channel power trend
Real FactoryVue dashboard · live values · captured 24 September 2026

One practical platform

Turn plant signals into decisions people can act on.

FactoryVue connects PLCs, meters and purpose-built sensor devices to role-appropriate dashboards. Engineers see the detail, managers see performance, and maintenance teams get the history and evidence needed to close the loop.

Retrofit friendlyConnect legacy and non-PLC equipment
Device to actionMeasure, trend, alert and maintain

Solutions

Clear categories. Purpose-built views.

Start with one problem or connect the whole site. Each view is shaped around the equipment and the decision—not a generic dashboard template.

01

Production & ovens

See each run, not just the final result.

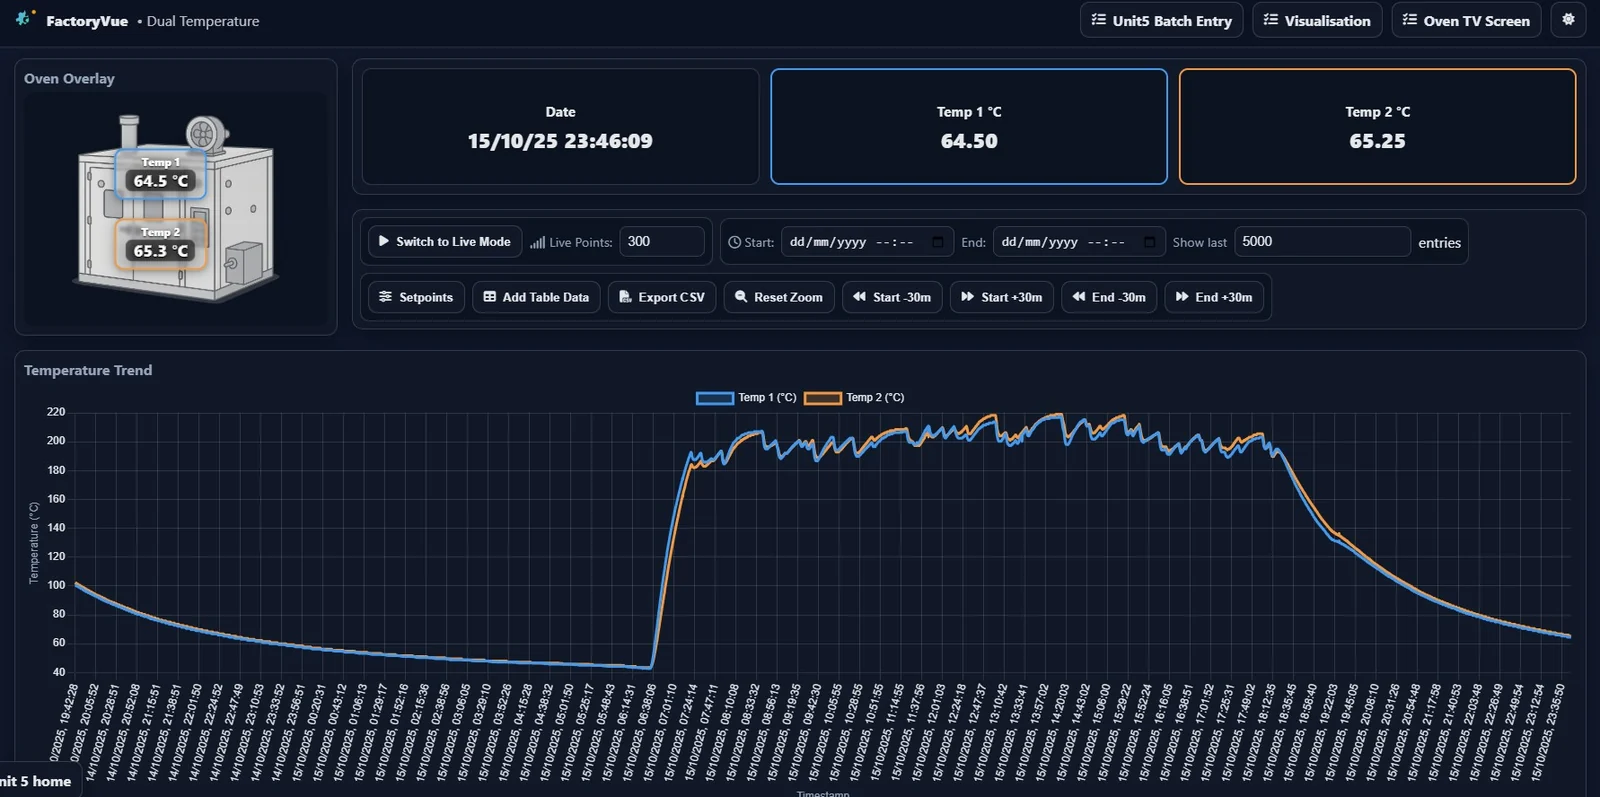
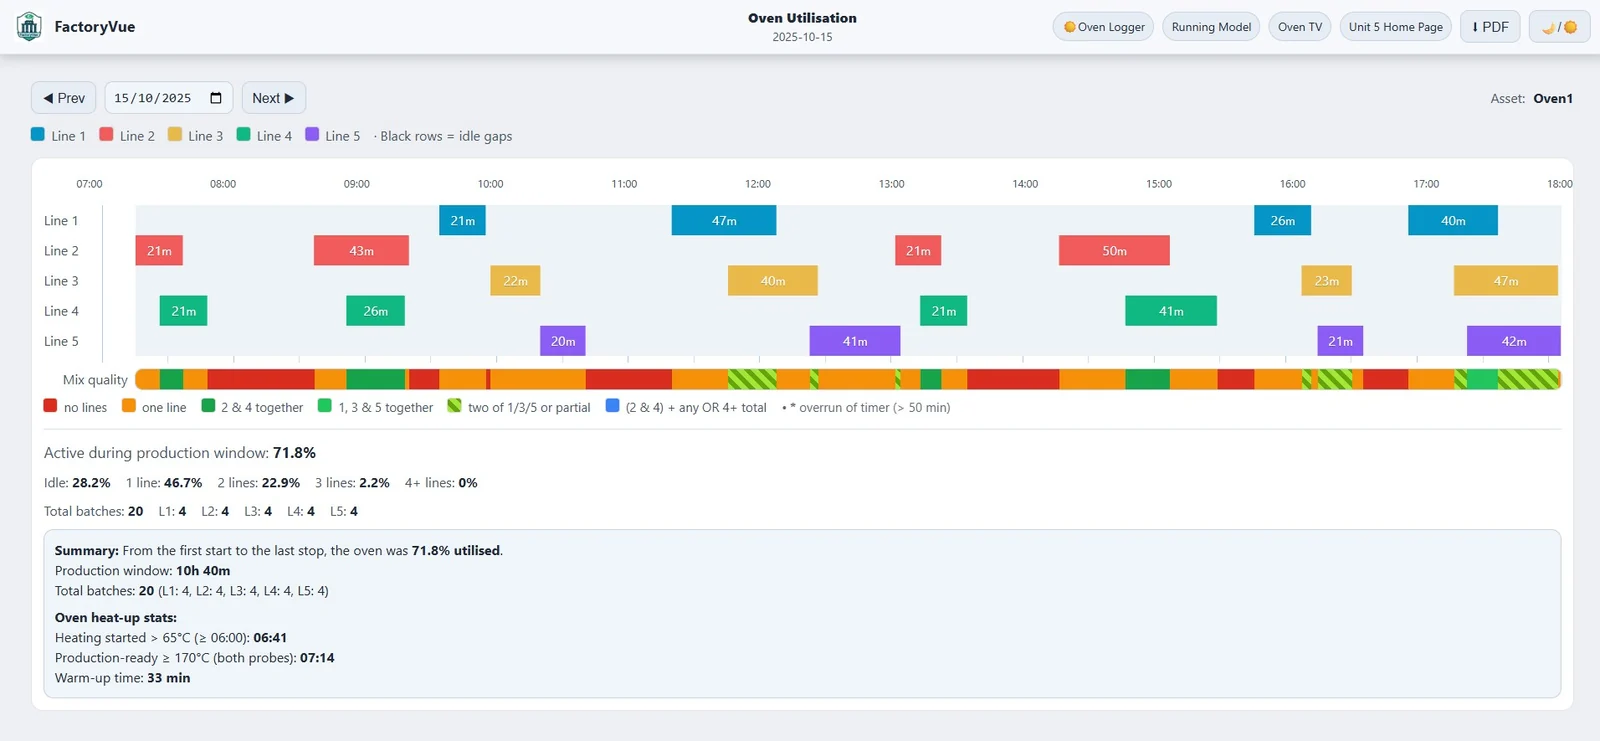
Track dual-channel temperatures, heat-up, setpoints, batch timing and utilisation. Operators can see the current state while engineers retain the full process history.

  • Dual and high-temperature logging
  • Oven utilisation and batch timelines
  • Setpoint, alarm and export tools
Temp2CHHighTemp2CHBatch loggerOven TV
FactoryVue dual-temperature oven dashboard with live values and a process trend
Temperature profile
FactoryVue oven utilisation dashboard showing five production lines
Utilisation and batch mix
Live platform viewFactoryVue site power dashboard with live current, voltage, power factor and demand trends
02

Energy

Make consumption understandable.

Bring site totals, individual meters and equipment loads together. Compare periods, reveal out-of-hours use and translate kWh into cost and carbon.

  • Site, category and meter-level reporting
  • Demand, cost, CO₂ and power factor
  • Daily, weekly and monthly comparisons
Energy meterSite EnergyPower dashboard
03

Condition monitoring

Find developing faults before downtime finds you.

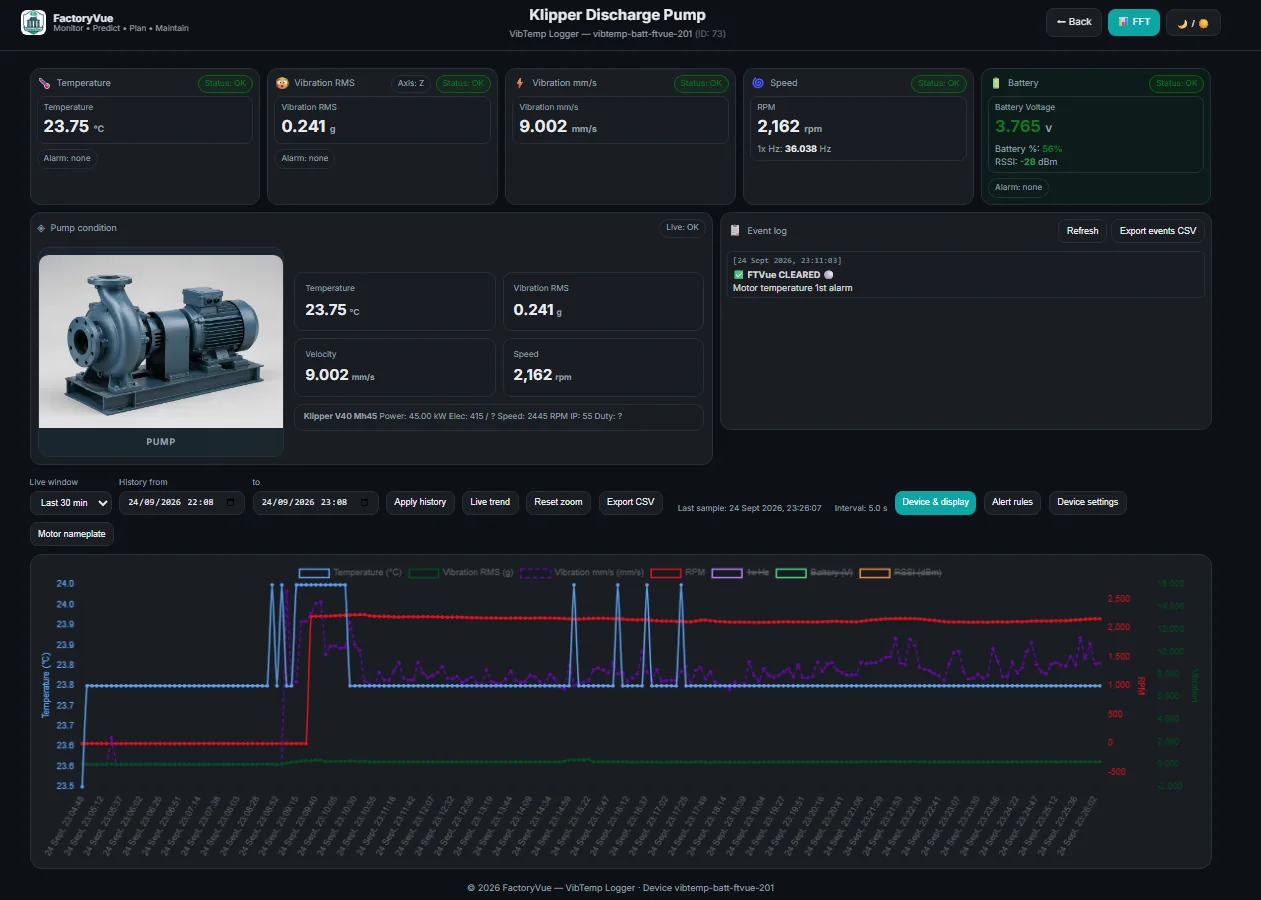
VibTemp combines temperature and vibration trends with detailed FFT and waterfall analysis. MotionGuard adds movement and theft-event monitoring for vulnerable equipment.

  • Velocity, acceleration, RPM and temperature
  • FFT capture and waterfall analysis
  • Threshold alerts and machine history
VibTempVibTemp FFTMotionGuard
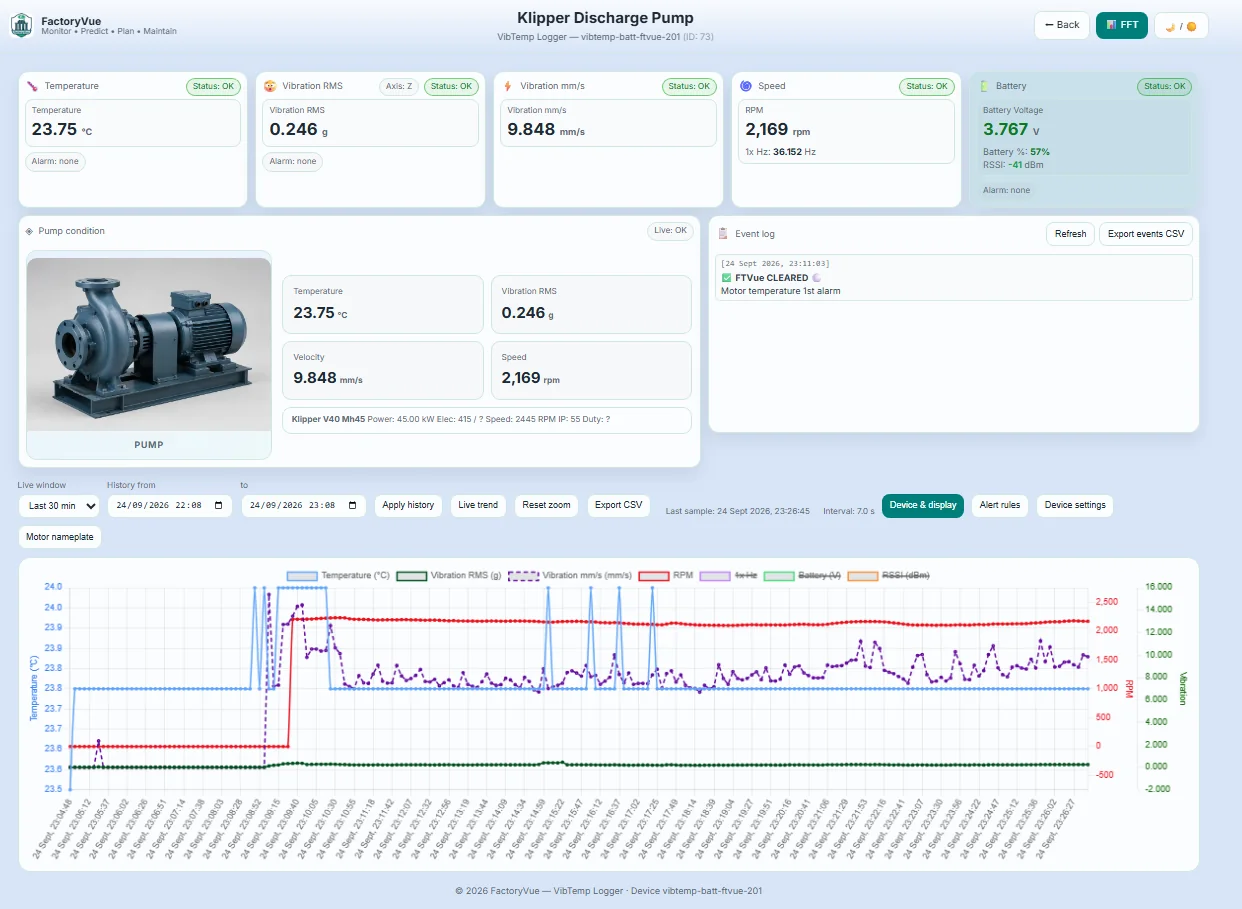
Live VibTemp viewFactoryVue VibTemp dashboard showing live pump temperature, vibration, velocity, speed, battery and history
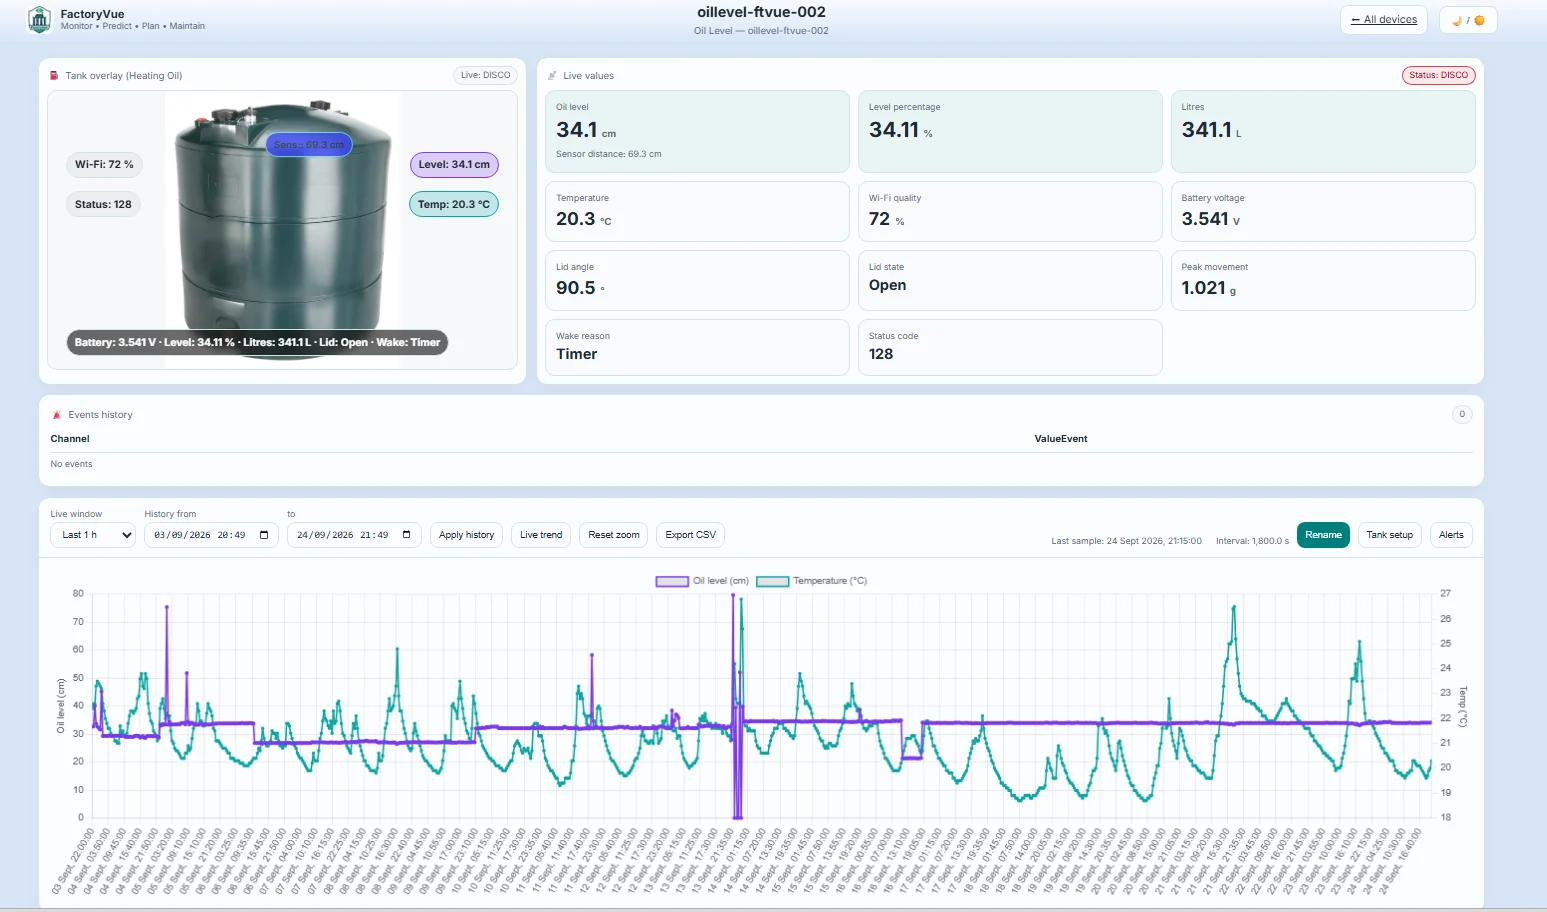
Live Oil Level viewFactoryVue Oil Level dashboard showing live level, litres, temperature, device state and history
04

Levels & utilities

Keep essential services visible.

Monitor oil, water and process levels alongside compressor status and utility equipment. Trends and alerts make replenishment and abnormal operation easier to manage.

  • Tank and oil-level history
  • Low/high-level thresholds and alerts
  • Compressor pressure, temperature and service counters
Oil LevelAI-2CH loggerCompressorUtility meters
05

Maintenance & compliance

Connect insight to accountable work.

FactoryVue Maintenance manages the asset record after monitoring identifies the problem: requests, work orders, planned maintenance, inspections, documents and statutory evidence.

  • Asset hierarchy, history and QR access
  • Work requests, work orders and PPM plans
  • Daily checks, statutory inspections and remedial tracking
Asset registerPPMWork ordersStatutory register
Maintenance overviewToday
Open work12
PPM due4
Checks96%

Inspection dueElectrical distribution · today

Due

PPM completedCompressor service · evidence attached

Done

Work order assignedConveyor drive · planned

Open

Illustrative neutral data; a current compliance/PPM capture is reserved for the final screenshot library.

Dashboard library

Real screens, organised by the job they do.

Approved captures retain their live values. Customer and personal identifiers are excluded from the public library.

Dual-temperature production trend
Production & ovensDual-temperature trendDesktop · live values
Oven utilisation timeline
Production & ovensOven utilisationDesktop · live values
Live site power dashboard
EnergyLive site powerDesktop · live values
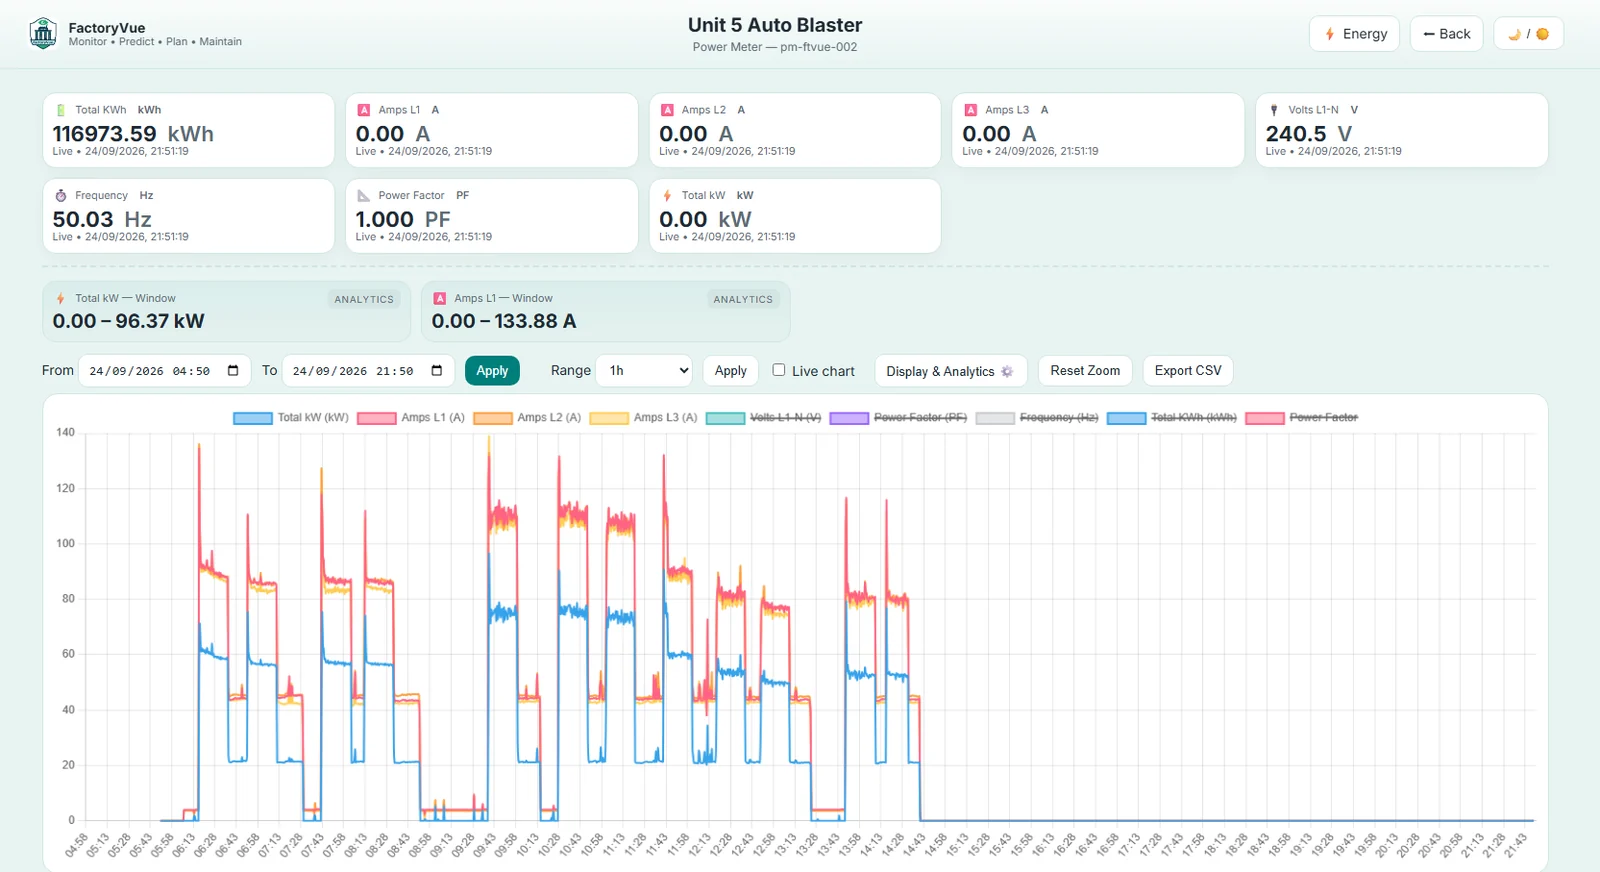
Live Auto Blaster power dashboard
EnergyEquipment load profileDesktop · live values
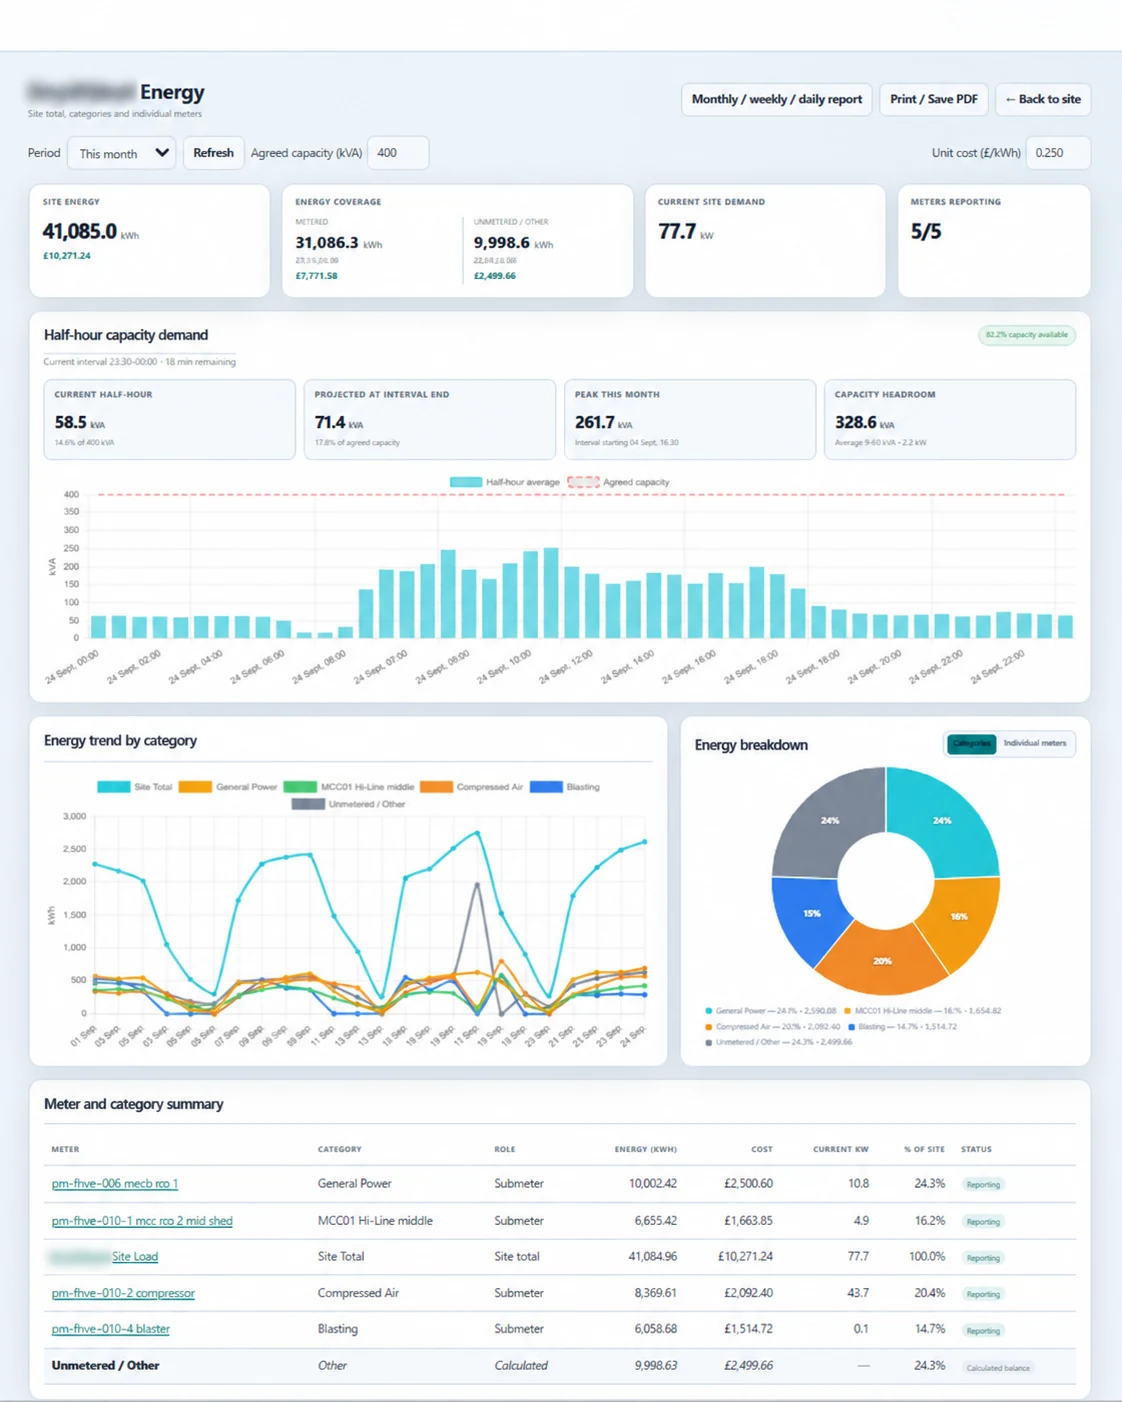
Full-screen FactoryVue Site Energy page showing demand, category trends, breakdown and meter summary with the customer name blurred
EnergyFull Site Energy viewDesktop · customer name blurred
Live VibTemp pump condition dashboard in the light theme
Condition monitoringVibTemp machine overviewDesktop · live values
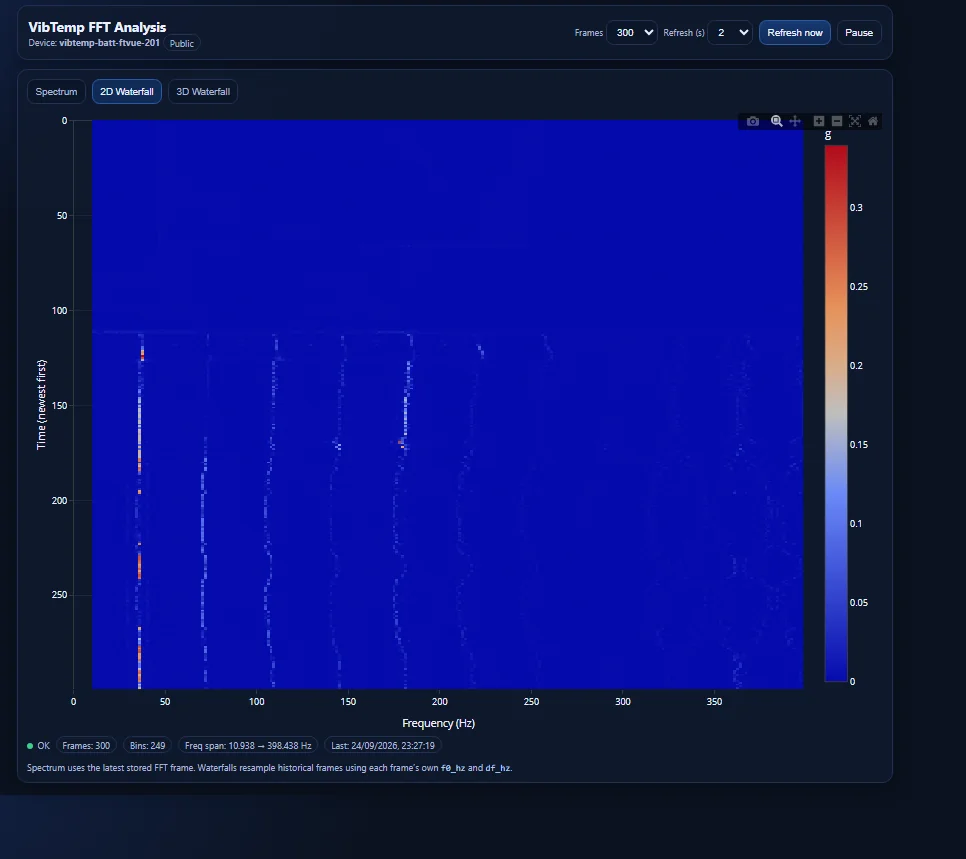
Live VibTemp two-dimensional FFT waterfall showing vibration intensity by frequency and time
Condition monitoringVibTemp 2D waterfallDesktop · live FFT history
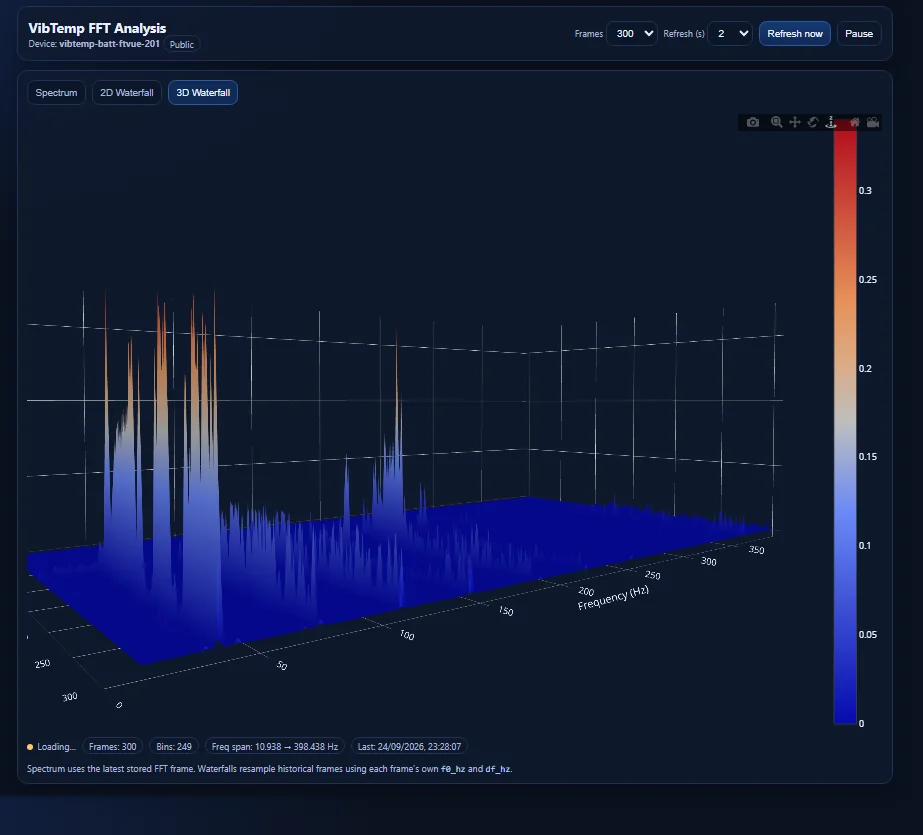
Live VibTemp three-dimensional FFT waterfall showing vibration peaks over time
Condition monitoringVibTemp 3D waterfallDesktop · live FFT history
Live Oil Level dashboard
Levels & utilitiesOil Level overviewDesktop · live values
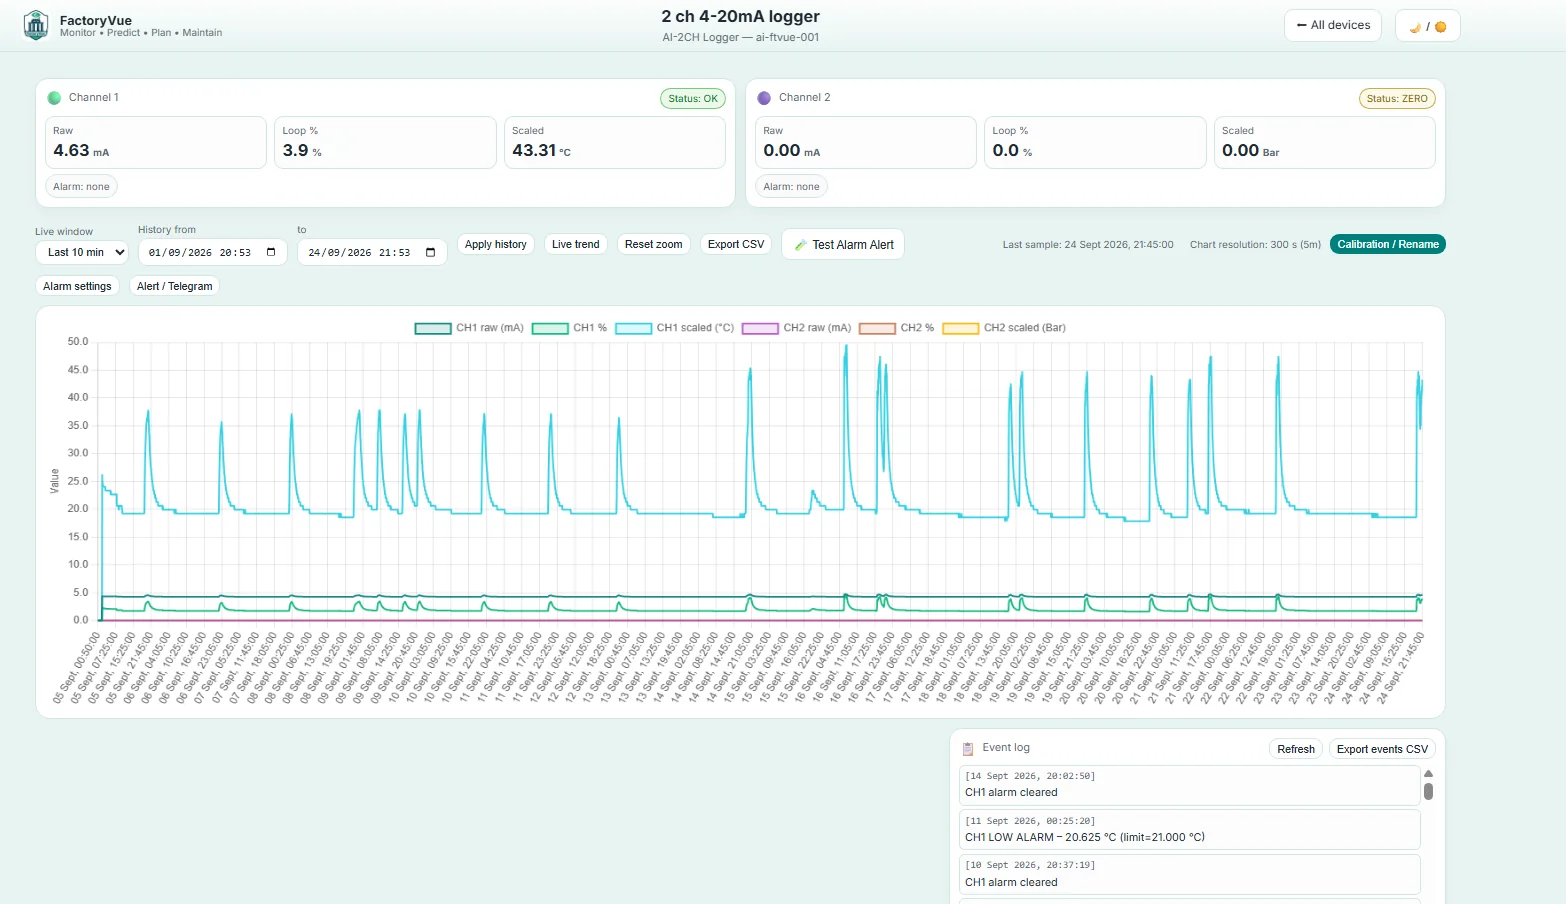
Live two-channel 4 to 20 milliamp logger showing temperature, pressure and event history
Levels & utilitiesTwo-channel analogue loggerDesktop · live values
Capture requestedCompliance + PPM

Neutral tenant showing the overview, statutory register and planned work.

90-second Factory Health Check

Where could your factory be quietly losing money?

Answer five practical questions about compressed air, downtime, temperature and maintenance. See editable cost examples and useful observations immediately—without entering a name or email address.

Five questions · sourced facts · no promised savingsStart the health checkOpens a separate FactoryVue test page.

How to start

Begin with one problem worth solving.

A short discovery conversation identifies the equipment, signal and decision that matter. From there, a focused pilot proves the value before anything expands.

  1. 01
    Choose the problem

    A machine, energy load or maintenance workflow with a clear operational cost.

  2. 02
    Connect the signal

    Use an existing controller, meter or a suitable FactoryVue retrofit device.

  3. 03
    Turn insight into action

    Agree the dashboard, alerts, ownership and evidence the team actually needs.

Talk to an engineer

What do you need to see more clearly?

Tell us about the machine, energy issue or maintenance challenge. We’ll discuss what can be measured and whether a focused pilot is worthwhile.